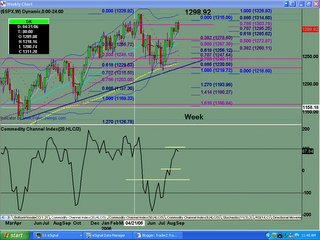
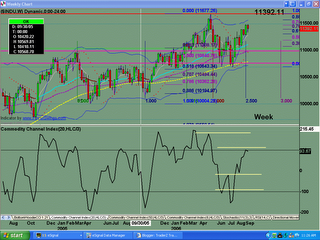
ES #F 091506 Options Expiration and New Contract High
Options expiration. Globex low sitting at 1328.00, and 6 points off the low gives us 1334.00, and 8points off the low gives us 1336.00, and 10 points off the low gives us 1338.00. We have a 1.618 fib target at 1336.50 -.75. All charts are currently extremely bullish. We have wave extensions, making wave counting a little bit more difficult. The price movement off the daily chart this past week makes the weekly and monthly charts more bullish.
This morning we had inflation numbers come out that states inflation is the highest its been in a while, and yet the market powers up. In a bull market, the market ignores bad news, and in a bear market, the market ignores good news. Is this typical options expiration activity?
After the open, will they try to sell this off to support?
Update at 09:30 EST: 1336.75 target hit; good sell short entry here with low risk.
Update at 09:50 EST: Market sold off to test the 1332.00 LIS, where old resistance becomes new support. Will this hold? We did make an abc 3 wave pattern down into 1331.75, which is a .786 fib level. 8min chart says more down is possible, however the 120min chart remains very bullish. Once again, the .786 fib now gives a bullish gartley butterfly pattern for a good JOT entry long. The only concern is that the 8min chart is NOT in agreement, therefore NOT an ideal trade, but it is a buy signal nonetheless.
Update at 10:17 EST: 5 waves into double top at 1336.75 for a quick pullback. Market remains bullish still, so let's see how shallow/deep of a pullback we can get. Let's see if we can reach 1333.75 and lower. IF the high is in, THEN we can expect an abc type of retracement to the .618 of range, which takes us to 1329.50 ish and gap close.
Update at 11:00 EST: Target of 1333.75 hit (.618 fib), and short term support at .707 fib of 1333.25. Weak buy signal here off the 6000V chart. However, the better buy would be a test of the current low at 1331.75, if we can get a good buy pattern setup there.
Update at 11:17 EST: Market testing today's low, but no good buy pattern can be found, so lower it will go.
Update at 11:25 EST: 5 waves down into 1331.25 so expect some kind of retracement. Market however, is more bearish now.
Update at 12:00 EST: Market remains bearish. .618 fib target is at 1329.25 and gap close is at 1329.50.
Update at 13:00 EST: gap is now closed. Continue to have mixed signals. Looking for bigger retracement.
Update at 14:03 EST: Looking for test of high and higher now.
Update at 14:16 EST: 5 waves up into 1333.75 -- looking for retracement before higher. Mixed signals so caution is in order. I can make the case for both up and down, so watching lower timeframes carefully.
Update at 14:36 EST: abc into .707 fib level at 1334.50. Wave c had 5 waves or "drives to top" pattern. Looking for retracement now. IF this is a wave 4, THEN we should see a lower low for completion of wave 5.


