Saturday, July 22, 2006

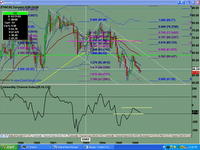
Powershares Clean Energy ETF PBW Chart Analysis


There is a Green Energy Stock Challenge that I have been thinking of entering since it began. However, I have been using the PBW as a guide to help me enter the market to buy the shares to make up the $200,000 virtual portfolio. There was nothing in the charts to tell me that it was time to enter the market, and the past two weeks have proved me right. If anything, I wanted to sell short or to buy puts on most of the stocks that I considered worth buying (that met my criteria) that were eligible for the stock challenge. Since I wasn't interested in "daytrading" or "scalping" the stocks for any upmoves, I decided not to enter the stock challenge at this time.

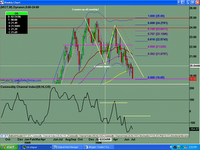
Weekly chart shows no buy signal at all.

The daily chart shows the PBW trading below all moving averages, especially the 34ema now which shows a strong downtrend. We also hit a LIS and now "old support becomes new resistance", and we have fallen through the 200 sma and heading down.

$TSX Chart Analysis


Monthly chart looking toppy and bearish.

Weekly chart shows resistance at the .618 fib level with a spinning top and a doji showing investor indecision followed by selling for this past week. Looking for test of the lows for now.

Daily chart shows weakness -- trading below all moving averages, especially the 200 sma. We have had 5 waves down, and an abc retracement into PRZ which provided more selling this past week. I would not be surprised if the index continues to go down.

Friday, July 21, 2006

Where are the Bulls?


Price action confirmed weakness of the chart. 120min chart showed no buying all day. Market closed for the day and week near its low.

Mission Accomplished

PRZ target hit. Gap at 1246.75 and .618 zone. Looks like it can go lower still. Since the .618 target has been hit, expect it to range for a bit ... and to retrace a bit of the move before going lower. Watching closely for bigger move up to begin.

Test of Top Again

Test of globex high a great opportunity to enter the short. Let's see if we can close the gap, and reach .618 of the leg up from 131.00.

Thursday, July 20, 2006

Picture Perfect


120min chart is picture perfect to show a well defined ss pattern, beginning with the double top into a strong PRZ.

Double Top ES #F 072006

Double top at the 1269.00 good entry for the ss today. First target is the 618 retracement level, then the gap at 1262.50. Let's see if we can retrace the whole of the move up from 1231.00 or not, first, before going higher.

Wednesday, July 19, 2006

Trending Day

The market started moving up and never looked back. The gap at the 1268.25 finally closed. Higher timeframe charts are now overbought, but with no ss pattern in sight.
PRZ zone of 1268 to1269 ish. Good area for long exits of ss entries.

ES #F 071906

Market looks like it has reversed from down to up, with the low at 1229.00 holding for now. We have possible end of wave 3 into the high at 1251.50. Looking for higher after wave 4 range is complete. Daily chart has chart pattern for more up... just need to watch the lower timeframes for confluence of upside momentum to confirm the upside move. IF we have 5 waves up, THEN I will be looking for a big abc move down to retrace the leg up from 1231.00 low... targeting the 618 fib as eventual target. If we are in fact in a bigger Wave 4 for more down ( lower low than 1229.00) then I expect we can be stuck in this range for a while for a complex corrective pattern to be played out.

Tuesday, July 18, 2006

Test of prior low


The market went to test the 1229.00 low, stopping 2 points from it, at 1231.00. The trouble with wave 4 patterns is that once wave 5 completes, the market will have a larger retrace. The key is to try to determine where wave 5 might end. A clue that wave 5 had completed was the ES #F day session only chart, showing a clear buy pattern.

Now that we have tested the 1229.00 low, let's see if there are enough bulls bullish enough to take the market up higher to re-test the high at 1331.25. So, the upside targets that I will be eventually looking for will be: 1292 to 1309.25 and within a couple of points of 1331.25 high. But, before we can even get there, the market has to retrace the last leg down from 1290.00. I will be watching the daily chart for signs of strength for higher, or weakness for lower. For now, the daily chart shows potential for higher from here. Let's see what the market brings us tomorrow.

Plan the trade, trade the plan

New low made. Market continues to look bearish. Now we need to see how much we can retrace (if at all) before we go test the 1229.00 low and then possibly go lower. The higher timeframe charts (monthly and weekly) both say lower is in the cards. "Old support becomes new resistance" LIS at 1234.75 now.

1247.50 high held the market back. High probability trade to enter ss against that level. the first clue was a sell pattern off the 8min chart and double top at 1246.75 for another entry ss.
IF this is corrective wave, THEN will look for new low below 1234.75. The first clue that we might pull back against the 1247.50 was the idea that we were in a corrective wave 4 pattern. So, I have a target to aim for for the short entry, and then I look for the divergence and a sell pattern for a high probability trade. We also had a 3 wave pattern, with 5 waves in wave c into the test of the 1247.50 high. As per yesterday's post, the idea for this trade was also because it was against the LIS of 1246.50 to 1246.75.

ES #F 071806

Expect market to move up to test the 1247.50 high. Upside targets: 1245, 1246, test of 1247.50 for now. Then possibly 1253 to 1255 range if market very bullish.

Monday, July 17, 2006

Trading Range All Day


Market stuck in trading range all day, as I thought it might. The day session only chart shows that today's price action could be a wave 4 pattern being played out ... with one more push to the downside. LIS and "old support becomes new resistance" at 1246.50 held the market down today.

Corrective Wave type Pattern


This was the clue that we might be in a corrective wave. The market retraced after the 3 waves up into the 1247.50 high. Look for test of low. This would be opportunity to buy, expecting the low of 1234.75 to hold based on higher timeframe charts showing support for now. Upside targets: 1243.75 to test of 1247.50 before moving down. IF I believe that we are in a corrective mode for more down, THEN, I have to be looking for a JOT pattern to enter ss to ride this down to lower lows. However, the 120min chart shows up with no ss signal.

ES #F 071606

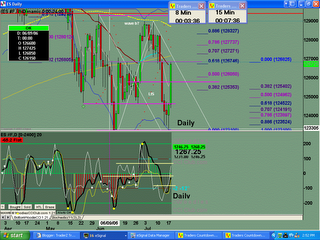
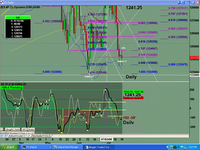
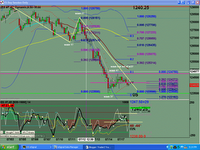
Market made a lower low by just 1 tick globex overnite. I see longs for today ... no shorts

Sunday, July 16, 2006

Motorola (MOT) Chart Analysis

I started following MOT when I heard an ex-hedge fund manager turned newsletter promoter, talking up his expertise on how to find investment opportunities to take advantage of the China play. One of the picks in his report was Motorola. Based on my analysis at that time, I didn't really see a good buy opportunity. Rather, I had the perfect setup for a sell opportunity.

Looks like 3 waves up into .382 fib level. I can count 5 waves in the third wave up. The market turned downwards from this .382 fib level, which is also prior resistance and now forms a LIS and change of polarity. I have a clear sell signal off this chart.

We are right at a LIS at the $18.70 level. Should this break, there will be more downside to come.

Since the monthly chart is in sell mode, I would be looking at the daily chart for JOT (jump on trend) entries to go SS (sell short).

Toll Brothers (TOL) Chart Analysis


Clear sell pattern in place. Now has almost reached a .618 retracement level.

LIS held price back. "Old support becomes new resistance". Perfect blue ice failure pattern.

Fannie Mae (FNM) Chart Analysis


Monthly chart in a clear downtrend from the high in 2001. Curently trading below all moving averages. LIS at $58.50 level holding market down for now.

Weekly chart showed small sign of possible reversal with a bullish engulfing pattern, but the past week's price action indicates that the bears are still in force for now. LIS at the $50 range currently holding price down. Looking for test of $46 level low then test of $41.30 level low.

Need to clear $50 range before more upside is possible. Charts showing weakness, and more downside action is more likely.

American Express (AXP) Chart Analysis


Monthly chart shows DT (double top) and break of prior small LIS at $51.27. The move up from the $21 low is in a 3 wave pattern into the DT. IF the top is in, THEN we could retrace the move up, and eventual downside target is the $28.55 range.

Weekly chart shows a close right at a LIS. Price tagged the .382 fib level and right at the UTL (uptrend line) drawn. Let's see what kind of follow thru, if any, to the downside we will get for the coming week.

We have a blue ice failure pattern in place. Let's see how far it goes before retracing. Friday ended with a spinning top type of candle pattern. Price is currently trading below all moving averages.

CURRENT MOON
lunar phase