Saturday, July 15, 2006

3M (MMM) Chart Analysis


Monthly chart shows corrective wave in progress. More downside action likely for now.

Bearish gartley butterfly type pattern in place. First tgt is $73.65, then test of $69.71 low, then $63 to $64 range.

Daily chart shows kicker type pattern with gap above the $80 level. Then another kicker type pattern to the downside, with a gap thru the same $80 level, and below the 200sma.

$BKX Chart Analysis


Monthly chart shows possible 5 waves up into high at 113.73. Possible support at 105.60 range to 97.60 ish.

Weekly chart has a triggered sell pattern in place. For now, prior resistance at 105 area is currently acting as support. Once that gets broken (likely), initial downside target will be 101 range.

Daily chart shows support at the 200sma for now. Resistance is at LIS above. Daily chart shows index could go either way here, with the weekly chart showing a little more bearishness.

Marriott International (MAR) Chart Analysis


Monthly chart shows potential bearish engulfing candle reversal pattern forming at the UBB. Market is still bullish until sell pattern is triggered.

Weekly chart shows 2 weeks of selling. Lets see if old resistance becomes new support at the $34 to $35 level. Chart indicates that selling could take price down to $32.64 ish level and possibly lower.

Daily chart shows relentless selling, sending price thru prior resistance to test the $34.70 low.

Mellon Financial (MEL) Chart Analysis


Monthy chart shows 3 wave abc structure into the $39 range high. Move up shows divergence, with triggered sell pattern in place. Downside move targeting PRZ at the $27 dollar range -- confluence .618 fib level and prior low.

UTL broken and prior resistance did not hold as support. Looking for possible bounce to 34ema, and failure to the upside will provide shorting opportunity with blue ice failure pattern.

Blue ice failure was opportunity to enter ss, as did break of LIS showing old support becoming new resistance at $34.82 level. This week's price action held back by 200 sma and downside pressure sent stock thru another LIS at $34.10 range.

Analysis of Lumber Futures


Monthly chart has been stuck in a huge congestion zone since the early 1990's.

Weekly chart shows a blue ice failure pattern which also conincudes with the 89 sma as resistance, sending the price of lumber to test last year's lows.

Apple Chart (AAPL) Analysis


Monthly sell pattern triggered. Target is the PRZ at $36 to $38 level (prior resistance and 618 fib)

Weekly sell signal triggered January 2006 with bearish engulfing candle reversal pattern at the UBB and with divergence.

Looking to see if we can find support at the $36 to $40.00 range

Four Seasons (FS) Chart Analysis


Monthly chart shows weakness here with LIS being broken to the downside. IF the TL breaks, THEN look for test of the $25.25 low

Sell pattern triggered. Weekly chart shows mkt heading to test the prior low at $47.00 range

LIS broken with gap. Momentum gathering with break and close below 200sma. Confluence of chart patterns for the downside.

Dreamworks (DWA) Chart Analysis


Monthly chart clearly shows a developing 5 wave pattern. Bear flag (wave 4) congestive pattern finally broken to lower low last week.

Weekly chart showed overlapping or corrective wave structure and double top for a nice exit for longs, or for short sell entry.

Daily chart showed promising upside potential with kicker type pattern signal, faking out the bulls, as it immediately reversed and headed down. Blue ice failure confirmed bears in control, as did failure of LIS at $24.40 level to offer support.

Disney (DIS) Chart Analysis


Monthly chart shows a current 3 wave up into $31.00 area resistance at the UBB. The third wave from the $22.85 low has 5 waves up into the $31.00. June ended with a hainging man type of candle pattern and a higher high. The move up to $31.00 is with divergence. July opened lower and immediately sold off. IF the high is put in, THEN I will be looking for the following downside tgts: 1) PRZ $23 to $24.50 (prior low and .382 fib) 2) PRZ $21 to $20 (prior low and .682 fib) then lower to test the low at $13.50 range.

Weekly chart shows well defined sell pattern. IF there is follow thru on the weekly chart, THEN the price action will make the weekly and thus the monthly more bearish. Downside price action will help to trigger the monthly sell pattern.

Market shows huge gap down thru multiple support levels ( moving averages, prior LIS) showing the bears are in control.

Microsoft (MSFT) Chart Analysis


Monthly charts lots of resistance at the $28 to $29.00 area with 1) UBB 2) 89 sma 3) 786 fib level. This is where the market turned and headed back down. Currently trading below the 34ema and below prior s/r. Support is now at the 21.40 range.


Current LIS (line in the sand) is $23.80 range.


Daily chart shows big kicker type signal to the downside with a huge gap a few weeks ago. now ew have a blue ice failure and gaps, showing increasing momentum to the downside. Downside tgts now include test of the prior low at $21.46 and then possibly lower to test the $18.00 level low.

$NDX Analysis


Monthly chart is 1) below the 89 sma 2) at the UBB 3) at prior resistance and making a DT of sorts. The move up shows divergence. Last month ended with a doji, but the open for July and the lower low negates its power for a potential reversal. We have now broken thru prior s/r and moved below all moving averages.


Weekly chart shows TLB, and blue ice failure pattern.


Daily chart shows the fall thru 200sma with a gap and 2 blue ice failure patterns

Friday, July 14, 2006

Wal-Mart (WMT) Chart Analysis

Monthly chart shows a large congestive wave pattern and descending triangle. Major resistance at the $50.00 range. Price is currently below the 34ema and looks to be heading lower still.


The weekly chart shows the $50.00 resistance more clearly, and shows the test of the $42.31 low, and possible test of the prior lows at the $41.50 range. if that breaks, then downside tgts are: $38 - $39.00 range, then $34 - $35 range.


Chart shows increasing momentum to the downside with the gap downs through the prior low set from a couple of weeks ago.

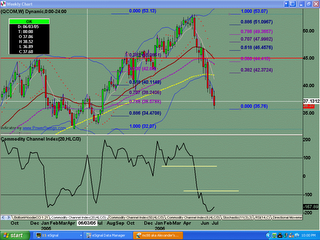
Qualcomm (QCOM) Chart Analysis

The monthly chart shows 5 waves up into prior resistance level at the $53.00 range. We have hit the UBB, and the move shows divergence. The monthly chart shows a sell pattern, and the puts were purchased on 06.24.06. The downside target is the 618 to 786 fib retrace of the move up from the 2002 lows.


The weekly chart shows a blue ice failure and short trigger with prior resistance at $45.00 level becoming resistance once again.


The daily chart shows price falling thru the 34ema and the 200sma.

Analysis of $BTK

This chart shows that we have a possible 5 waves up into .886 fib level, UBB and test of the prior top. The move up shows divergence. Based on the chart pattern(s), I would not be surprised if we proceed to retrace the entire move up from the 2002 lows. Eventual downside tgts could include the .786 and .886 fib levels.


The weekly chart shows major resistance at the .382 fib level and the 34 ema. IF the current low at the 614.53 level does not hold, THEN I would expect the first downside tgt to be at the PRZ of 575.5 ish. This is where we have prior resistance that could become new support, and it is also at the .382 fib level and the 34ema.

The daily chart shows the resistance a little bit more clearly. The daily chart shows a strong PRZ at the 1) 200 sma 2) 89 sma 3) .382 fib level 4) LIS (line in the sand)

Remember to look at higher timeframe charts

The 60min chart still looks mighty bearish, and the 8min chart showed a JOT 5034 pattern ss, with 5 waves up into a PRZ with 34ema resistance, and the GL of 1242.25 holding the market down.

Potential Reversal Zone


Well, we finally had continuation downside action after PDL at 1246.50 proved to be resistance. We went to the PRZ with the 1.27 fib and .886 fib cluster.

The 15min chart showed reversal is in the cards. The PRZ is also at the LBB and near the medianline of Andrews Pitchfork on the daily chart as shown in chart below.

Backend Support and Fib Support


ES #F 071406
Originally uploaded by TraderZ.
As the daily chart indicated, we had a nice drop yesterday to projected targets. Overnite globex found support at the .786 fib level of 1242.00 ish and we had prior backend support at 1246.75 for a nice bounce to globex high of 1251.50. We will probably range for today after yesterday's nice trending move. We have fallen thru the lower tong of the Andrew's Pitchfork, so a retracement bounce could go back to test that lower tong as resistance at the 1256 to 158 level. Lots of resistance in this zone.

Thursday, July 13, 2006

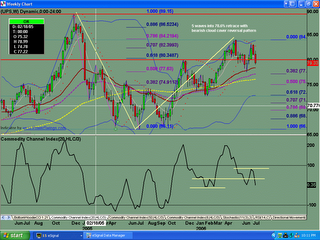
UPS Weekly Chart 071306

We have 5 waves up into a .786 fib level and ending with a bearish engulfing candle reversal pattern. We have a test of the high on a retrace, and now looking for retrace of the move up from $66.10 low. Old resistance as new support at $80.00 level has now been broken to the downside. Downside targets: 73, 71.36, 70, and test of 66.12 0 low.

$NDX Monthly chart 071206


$NDX leading the way for the deep pullback in the markets ... to test or break prior lows. Sell pattern triggered. Looking for at least a .382 fib retrace, and then lower.

Elliott Wave Count for $SPX 07.12.06


This is my Preliminary Elliott Wave count for the S & P 500.

Home Depot Monthly Chart 071206


Home Depot showed resistance at the 44.25 level. Price has now fallen thru the moving averages. Expecting a retracement before a move lower

CURRENT MOON
lunar phase