Qualcomm (QCOM) Chart Analysis
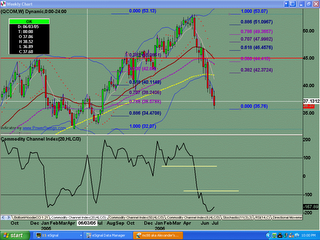
The monthly chart shows 5 waves up into prior resistance level at the $53.00 range. We have hit the UBB, and the move shows divergence. The monthly chart shows a sell pattern, and the puts were purchased on 06.24.06. The downside target is the 618 to 786 fib retrace of the move up from the 2002 lows.

The weekly chart shows a blue ice failure and short trigger with prior resistance at $45.00 level becoming resistance once again.


The daily chart shows price falling thru the 34ema and the 200sma.


0 Comments:
Post a Comment
<< Home