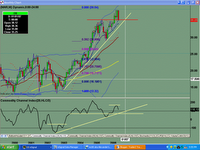
Marriott International (MAR) Chart Analysis

Monthly chart shows potential bearish engulfing candle reversal pattern forming at the UBB. Market is still bullish until sell pattern is triggered.

Weekly chart shows 2 weeks of selling. Lets see if old resistance becomes new support at the $34 to $35 level. Chart indicates that selling could take price down to $32.64 ish level and possibly lower.

Daily chart shows relentless selling, sending price thru prior resistance to test the $34.70 low.


0 Comments:
Post a Comment
<< Home