$NDX Analysis

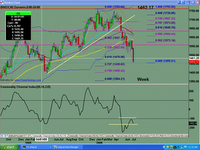
Monthly chart is 1) below the 89 sma 2) at the UBB 3) at prior resistance and making a DT of sorts. The move up shows divergence. Last month ended with a doji, but the open for July and the lower low negates its power for a potential reversal. We have now broken thru prior s/r and moved below all moving averages.

Weekly chart shows TLB, and blue ice failure pattern.

Daily chart shows the fall thru 200sma with a gap and 2 blue ice failure patterns


0 Comments:
Post a Comment
<< Home