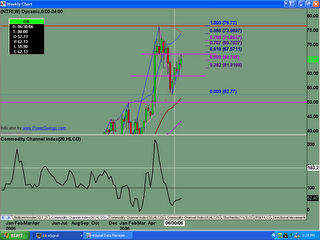
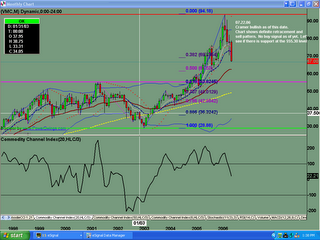
I have been noticing a lot of 3 wave structure patterns the past year, occuring in all timeframes, from intraday all the way to monthly charts. Does the 3 wave structure pattern on a monthly (longer) chart indicate a bigger picture congestive or corrective pattern? There are those that say we are in a secular bear market, and that we are in a big picture corrective wave. Others say that markets are fractal in nature. Is what I am seeing an example of that? I will be keeping an eye on the monthly 3 wave patterns to see how they play out in real time.

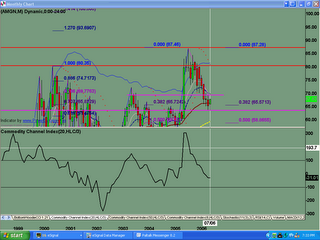
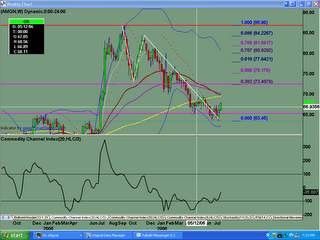
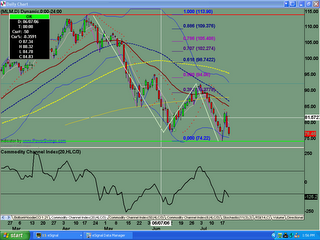
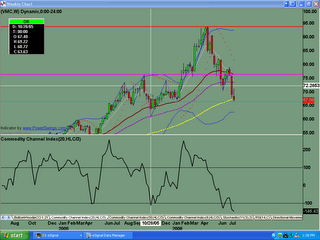
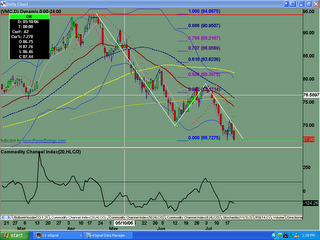
The monthly chart of 3M shows a clear 3 wave pattern down to $69.71 low before making a retracement back to test the high with another clear 3 wave pattern. Then the stock sold off to test the $69.71 low for the month of July. Can we go lower, only time will tell.

The daily chart of XLE (Amex Energy SPDR) shows a clear 3 wave structure down before retracing with a 3 structure into the .786 PRZ. Will this current down move make a lower low? Only time will tell.

The daily chart of JNJ shows a clear 3 wave pattern up before making a correction that overbalances. Then it takes off to new highs, and completing another 3 wave structure before retracing. Now we have tested the high at the $62.00 to within a penny. Will this be a double top and we head down from here? Or will we break through the resistance to go higher? All three timeframe charts say that it could go either way.

The 6000V intraday chart shows a clear 3 wave pattern retracement before making a run to test the high and making a double top before selling off for the day.

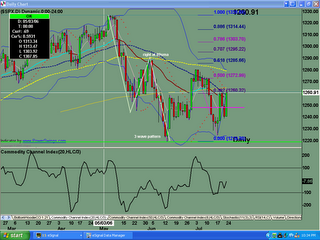
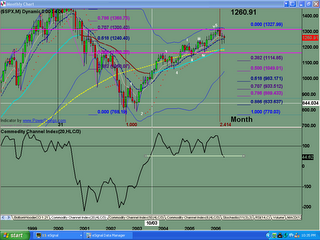
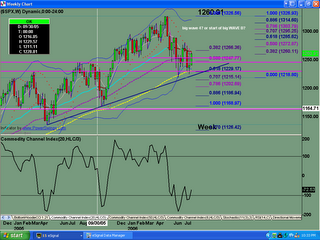
The $SPX index chart shows a clear 3 wave pattern down before a retracement that overbalances, finds resistance, and heads back down to test the lows yet again. Can we make a lower low after this 3 wave pattern? The next couple of weeks are going to be very interesting to watch. The charts show that more downside is indeed possible.


