Friday, September 01, 2006

$TYX Weekly Chart Analysis 090106


Index found support at the 1.618 fib level, making an inverted hammer candle pattern. Look for initial support and a move up. We also have 5 waves down in this current downtrend. Move down as been with divergence as well.

No buy signal as of yet.

According to this chart, interest rates are projected to move lower.

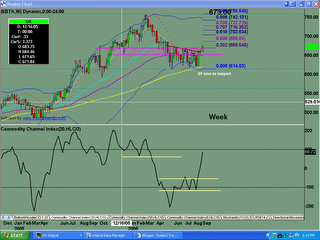
$BTK Weekly chart Analysis 090106


Market found resistance at the 200 sma.

Weekly chart shows upside bias with no sell signal in site. Support at the 89sma.

Resistance at prior resistance of 675.67. We have support as shown by the weekly chart, and market looks like it wants to test the highs.

$NDX Weekly Chart Analysis 090106


Bullish engulfing candle at support for retracement to test the highs?

Weekly charts indicate upside movement. No sell pattern in sight.

Possible 5 waves up into resistance. The day ended in a doji candle pattern, indicating indecision.

$SPX Weekly Chart Analysis 090106


The market found resistance at the 1.618 fib level. We are either in a wave 4 or wave B type of pattern. Wave 4 indicates higher high to come; Wave B indicates resistance at testof high for lower.

The weekly chart currently shows no sell pattern; it does however, show that we should be on the lookout for a possible sell pattern showing up.

Monthly chart looks strong with no sell signal as of yet.

$INDU Chart Analysis for 090106


The daily chart shows strength, and is looking to test the highs of the year at 11,670.19. Great start to the beginning of the month. Currently price had made more than a .786 fib retrace of the last move down.

This move up for the past week was foretold by the weekly chart. Look for test of the highs and a possible pullback once we test there.

The monthly chart continues to show uptrend, and we have no sell pattern completed as of today's date.


ES #F 090106 A New Month and a New Market High

We are still stuck in the same old range. With a long weekend ahead of us, and many traders already taking advantage of the holiday ahead, I don't expect much to happen today. The longer term timeframe charts look toppy and bearish. The daily chart remains bullish looking, but is in overbought territory.

Update at 08:31 EST: Report out; Made a high at a PRZ level of 1309.50 and sold off. Good sell short entry there. 1309.50 was both a 1.27 fib and a 1.414 fib, and it made a higher high for wave 5, after the wave 4 congestion/consolidation wave. The larger range .786 fib level was 1309.50. IF the market remains bullish, THEN the next target is 1311.75 gap above.

Update at 09:36 EST: Market opens up bullish making new high. 1311.25 is a 1.414 fib level. This is a PRZ so another good sell short entry, as I see a 5 wave structure up into 1311.25 high.

Update at 10:08 EST: Market finds s/t support at that old LIS of 1297.75; expect that to get broken and looking for a gap close as high probability (gap is at 1305.50).

Update at 10:38 EST: 120min and 60min charts both remain bullish currently. Market found support at 1306.50 for a decent retracement bounce into .382 fib level so far. Lower timeframe charts show weakness and either we range, or we go down.

Update at 10:53 EST: Test of the 1311.25 high for a quick sell short.

Update at 12:05 EST: 1311.75 gap filled and it is also a 1.414 fib level. Another good sell short entry with minimal risk. Price action remains bullish, so caution. It is possible we have to make a higher high, as I only count 4 waves in this last move up.

Update at 12:58 EST: Currently wave 3 is extending, so we high has not been put in yet. This is supported by the bullishness of higher timeframe charts. In other words, no sell pattern in place for daily, 120min, 60min, 30min and day session only charts. This move up to new highs confirms what I saw on the weekly charts from 2 weeks ago.

Update at 13:06 EST: 1314.00 is a 1.618 fib level for a small retracement. Still no sell signal off the 120min. chart. Still a good entry for a short scalp, and perhaps have a tight stop.

Update at 14:37 EST: We had 3 waves down into 1306.25 low, then a 3 wave pattern up into new high of 1314.00 and now we have overbalanced. Could this be a running flat type of wave pattern? We had divergence going into the 1314.00 high, and higher timeframe charts had blinky sells, even though the 120min cci was still above the +200 level.

Another way of counting the waves gave me 5 waves up into 1314.00 high with wave 5 having 5 wave extention. IF we have 5 waves up, THEN look for abc correction into the .618 fib level, which currently is at 1309.25, and also happens to be near OP of 1309.50.

Update at 14:46 EST: Short term support off LIS at 1311.25 and market bounces.

What did I learn from today? I learned that it is really important to know one's key levels, where the market might react to. Like the 1314.00 was a PRZ Then it is a good idea to enter into a trade with a tight stop. It is often more difficult to count waves, as sometimes the waves are not that obvious. When the market overbalances, then I have a means of identifying the "ends" for safer trade entries.

Thursday, August 31, 2006

ES #F 083106 End of the Month

The market has hit a .786 fib off the daily chart at 1308.76. This .786 fib level sets up a bearish gartley butterfly off the daily chart. We currently have mixed charts this morning. The lower timeframe charts are slightly bearish, but the higher timeframe charts show that upside is possible. When I see mixed signals like this, often it means we are stuck in consolidation/congestion range. So far, we have made 5 waves down into 1303.00.75 from the high of 1308.75; then we made an abc move into 1308.00 and test of high; now we have just made a 3 wave abc move down into lower low at 1303.00. Today is also month end.

Update at 08:35 EST: We have a test of top now for a low risk sell short entry.

Update at 10:30 EST: Market looks weak; continue to hold short.

Update at 11:20 EST: Looking for lower lows today.

Update at 12:10 EST: Stuck in same range waiting for Bernanke to finish. Market could go either way once he is finished. Daily chart in position for lower as are the 120min and 60min charts. Currently the 15min chart shows that it wants to bounce. We could be stuck in a small wave 4; then drop lower.

Update at 15:21 EST: Market tested the low, bounced, and is now re-testing the 1308.25 high from this morning. We remain stuck in a narrow range day.

Update at 15:58 EST: Marketing selling off the 1308.25 high test. Do we just extend in this triangle, or do we actually get to break down so late in the trading day?

Monday, August 28, 2006

ES #F 082806

The daily chart shows heaviness; however, the 120min and 60min charts show upside momentum for this morning. Globex low is at 1294.50, having made an abc 3 wave pattern down into that support level, which also happens to be a .707 fib level. It also happens to be a 1:1 price projection as well, thus making it a stronger PRZ. Upside targets for this upside movement are: 1299.00, 1301.00, test of 1301.75, and 1302.75 to 1303.75 and test of 1304.25 high. Currently market is finding short term resistance at a .382 fib level of 1297.25.

Update at 08:56 EST: In order for the daily chart to remain bearish, the market needs to sell off at higher levels than this morning. So, I will be looking for signs of weakness in which to sell short.

Update at 09:06 EST: We have a sell pattern off the 8min chart as a first trade pattern. It also happens to be against the 1297.75 LIS from last week. However, we didn't have confirmation from the 6000V chart, so expect higher risk and lower profitability.

Update at 09:42 EST. We closed the gap and slammed into 1297.75 LIS where we pulled back again to test the low. Remember the daily chart is bearish, so need to be aware of selling off this morning.

Update at 09:53 EST: First upside target of 1299.00 hit -- at the .786 fib and .618 fib for a nice potential PRZ; No sell yet off higher timeframe charts, watching closely. Next upside targe is 1300.00 area.

Update at 09:58 EST: 1299.75 is both a .707 fib and .886 fib level.

Update at 10:24 EST: 1301.00 target hit; also 1301.75 high test.

Update at 10:38 EST: 1303.75 target hit; it is a 1.27 fib level. Higher timeframe charts remain bullish. We have a gap at 1307.25 that remains to be filled. However divergence and important PRZ says we pullback here, how much remains to be seen.

Update at 11:06 EST: 1304.25 is a PRZ - 1.618 fib, .786 fib and also .886 fib. We also have possible 5 waves up off the 1294.50 low. However, 60min still very bullish.

Update at 11:21 EST: I do have 8min and 6000V charts showing sell patterns triggered. Remember, the .786 fib creates the bearish gartley butterfly. Let's see if this is the end of wave B and now the beginning of wave C or not.

Update at 12:01 EST: 1305.75 is current high, and it is a prior visual as well as 1:1 price projection and .886 fib level. 120min chart is still in extreme however, so if long, remain long as there is no sell signal in sight.

Update at 1:53 EST: Market remains bullish with no sell signal off higher timeframe charts. Upside targets for the remainder of today: 1307.25, 1307.75 test, 1309 to 1309.75 ish if market extremely bullish.

Update at 14:02 EST: 1307.25 g closed. 1307.50 is a 1.27 and a 1.414 fib projection as well as test of 1307.75. We have an ace 1 tick sell but market extremely bullish. Major PRZ in the 1309.00 to 1309.75 area. However, test of 1307.75 is low risk sell short for a retracement.

Update at 15:21 EST: The move up into the 1307.50 high was made with divergence. JOT sell short with the retracement into .707 fib level.

CURRENT MOON
lunar phase