Friday, August 25, 2006

ES #F 082506 Another Choppy Day

The daily chart remains in a sell pattern for the time being. The 120min chart this morning shows that 1299.00 is current high with the possibility of a move back down to re-test yesterday's low at 1293.50. We are at a major resistance cluster: 1297.75 LIS, below 34ema, below 89sma. It looks like a congestive/consolidation wave. Continue to have mixed signals, with the lower timeframe charts showing short term support at 1296.50. IF we are in a wave 4, THEN look for weakness and a move lower. Downside targets: 1291.50 test, 1290.50, 1287.75 gap close, 1285.00 and 1283.25. IF we go up, THEN look for 1300.75 high to be tested, then 1301.50 and 1302.75. IF we go up, I will be looking for opportunities to sell.

Yesterday's bearish butterfly pattern still in effect. Looking for lower lows today as highly probable based on chart patterns. 1297.75 LIS is holding prices back once again.

Update at 09:38 EST: short term support at a .786 fib level, which makes it a bullish gartley butterfly pattern. Note: yesterday's bearish gartley butterfly off 1299.00 went to first target at 1294.75 or .786 fib level. Higher timeframe charts remain bearish; price action bearish still.

Update at 09:57 EST: first butterfly target hit at 1298.00. Next target is test of 1299.00 high again. Then 1300.00 and test of 1300.75 high.

Update at 10:03 EST: Second target hit at 1300.00. Now the 1301.50 target has been hit. This sets up another bearish gartley pattern for the retracement. 120min chart still bullish right now. 1301.50 is the PRZ identified yesterday, where there is a lot of confluence.

Update at 10:17 EST: 1301.75 is a 1:1.27 fib extension, and also a .786fib level. and the bearish gartley butterfly pattern. Short 1301.00 and lets see how far it goes. Can we get lower lows today, or will 1293.50 low hold? Typically, the butterfly target(s) I look for are: .618 fib, .786 fib, test of prior support, then 1.27 fib.

Update at 11:07 EST: Small bullish gartley butterfly with short term support at 1296.50, but mixed signals. Let's see how far we can retrace with this butterfly pattern before continuation lower.

Update at 11:53 EST: Support at 1295.50; We have a bullish gartley butterfly here for a retracement. 1295.50 is both a .618 fib and a .886 fib level, so small PRZ.

Update at 12:24 EST: Resistance at the LIS 1297.75 and .382 fib level, which also happens to be the 34ema off 8min and 6000V chart. Upside target(s) for this butterfly are: 1299.25, 1300.00, 1300.25. Keeping in mind that higher timeframe charts still say down, so any retracement is an opportunity to look for a JOT sell short entry.

Update at 12:55 EST: Mixed signals, we can be stuck in this chop for a while. Currently testing 1295.50, and IF it hold, THEN we could see higher for test of 1298.25 and also 1301.75 resistance. IF it breaks, we shall go to test lower support at 1294.75 and 1293.50.

Update at 13:24 EST: Are we forming a wave B triangle? We are stuck in a very narrow range (less than 3 points), with charts looking bearish.

Update at 14:11 EST: resistance at the .500 fib level for now. Still stuck in the same range.

Update at 14:36 EST: .618 fib target hit at 1299.25. 5 waves up into 1299.50 so expect some kind of pullback or profit taking.

Update at 15:28 EST: 1300.00 target hit for the bullish butterfly pattern. 1300.00 is a .707 fib level. We now have 7 small waves up into the 1300.00 high (with regular divergence).

Update at 15:35 EST: 1300.50 hit - that is the .786 fib level; This of course makes for a bearish gartley butterfly for a nice sell short entry.

Update at 16:00 EST: Another .618 fib level hit and retracement.

Thursday, August 24, 2006

ES #F 082406 Butterflies are free to fly .... fly away .....

The daily chart shows potential 5 waves down into 1291.50 support. IF we have 5 waves down, THEN look for abc correction into the .618 fib level. Market looks like it has made the waves a and b, and now we are in wave c. Upside targets are: 1300.25 and 1301.50. 1301.50 is a potential PRZ, as it is a .618 fib, .707 fib and a .786 fib. It is also yesterday's OP. 120min. chart shows more upside is possible.

Update at 09:09 EST: First target at 1300.25 hit. 1300.50 is now a .707 fib level and a 1:1 price projection -- 120min chart still bullish. If chart remains bullish, upside target after 1301.50 is 1304.25 test (this is another PRZ -- .786, .886, 1.00 and 1.618 price projection).

Update at 09:49 EST: OP is at 1299.75 and market made a higher high at 1300.75 before pulling back in anticipatio of 10:30 EST report. 8min, 6000V and 15min charts now have a sell pattern in place, and looking for gap close at 1297.75. We have what looks like an abc 3 wave pattern into .707 fib level. 120min chart remains bullish for now. So long as the 1291.50 holds, we can look for a buy pattern upon re-test of this low.

Update at 10:01 EST: Gap is closed. Looking for more down now, and possible re-test of 1291.50 -- we could be stuck in this range for a while. Downside targets: 1293.50, 1292.50, test of 1291.50.... and possibly lower with 10;30 EST report.

Update at 10:38 EST: market more bearish now, as we have fallen back through the LIS of 1297.75. The high at 1300.75 is a possible end of wave b, and wave C could go lower, and it could impulse, so watch for possible fast downside action. Holding short position with a trailing stop for test of low at 1291.50 and possibly lower. The reason I believe that it is possible for lower is the position of the daily chart, and the 120min and 60min charts.

Update at 10:59 EST: Mixed signals, so we can be stuck in this range for a while. So far, we have had 3 waves up into 1300.75 high. Is this wave 4 of 5 waves, or is this the end of wave b and now we are in wave c? It's a tough call, so best to scalp off lower timeframes for better profitability. Both the 8min and 6000V chart gave a buy signal off the 1295.75 low. As did the 15min chart.

Update at 11:30 EST: Continue to have mixed signals. Higher timeframe charts slightly bearish. IF market goes back to test 1300.75, THEN look for a possible sell signal to be generated there. IF we go to test the low at 1291.50, THEN look for a possible buy signal to be generated there.

Update at 12:43 EST: Low now at .786 fib level and a bullish gartley butterfly pattern for a long entry. Watching carefully as higher timeframes still bearish.

Update at 13:22 EST: Bullish gartley butterfly working well. We have overbalanced, and looks to be heading higher. Upside targets to watch for: 1299.00, 1300.75 test, 1302.75 ish (potential PRZ).

Update at 13:45 EST: Butterflies everywhere -- we just had a small bearish gartley butterfly at the .707 fib for a swift downmove to re-test the low at 1293.50.

Update at 14:17 EST: 1299.00 upside target hit. Possible pullback here before higher. Higher timeframes still bullish, so let's see if we can reach 1300.75 test and then 1302.75. The current high at 1299.00 sets up another bearish gartley butterfly pattern. However, the 120min and 60min charts both remain bullish with no sell pattern developed.

Update at 15:16 EST: If short from 1299.00 high and bearish gartley butterfly, you were not stopped out -- looking for .786 fib at 1294.75 and possibly lower to 1.27 fib at 1292.00.

Wednesday, August 23, 2006

ES #F 082306 Breakout or Breakdown?

Still stuck in the same range as yesterday. Globex high found resistance at a .707 fib level. Globex low found support at a .618 fib retracement. Daily chart shows LIS at 1297.75. IF that holds, THEN we should see higher highs. Uptrend line on Daily chart remains intact. 120min chart shows a descending triangle pattern formation. Currently the 30min charts upside trend, looking for test of globex high at 1303.25 and possibly higher.

All charts show consolidation/congestion range. Let's see if we get breakout/breakdown today. We can go either way, so looking to lower timeframe charts for direction.

Update at 09:00 EST: Small bearish gartley butterfly off 1302.25 high.

Update at 09:33 EST; Gap is closed, and bearish gartley butterfly is still in play although I expect we will get stopped out, as price action is bullish, and OP is support. Okay, stopped out. 120min chart says we go up for a now. 1304.00 is a .786 fib level, but 120min says higher still. Upside targets for today: 1304.50, 1305.50, 1306.50, 1307.75 test, 1309.25, 1310.25

Update at 09:43 EST: 1304.25 is a 1.27 fib level for possible retracement before higher. Reason for taking the sell short: 1) 1.27 fib level 2) possible wave b as we had 3 waves or abc into the 1304.25 3) .786 fib. We have overbalanced, so possible we can go lower. Looking for test of 1297.25 low from yesterday and lower.

Update at 10:27 EST: Support for now at the .786 fib; Bear flag for lower?; retracement shallow. Higher timeframes still bearish; IF we continue lower, THEN a sell off the daily will be triggered for an even deeper pullback possibility. LIS at 1297.75 is key level for today.

Update at 10:45 EST: 1298. is both a 1.27 fib and a .886 fib level. But higher timeframes still very bearish, so lower still to come. Today' s test of 1297.75 low will be for the second time; i would expect this to become resistance once we break clear through to the downside.

Note: 1297.25, yesterday's low is now a 1.414 fib level. and a double bottom. Will it hold, or will it break? 8min chart says it is still bearish; so we can either go sideways or go down for now.

Update at 11:00 EST: 1296.75 was a prior level of support. Market pausing here for a bit. Downside target for today is 1290.50; lets see if we can get there today or not. We also have a gap at 1287.75 that remains to be filled.

Update at 11:09 EST: Market pausing at 1295.25 which is a 1.27 fib level.

Update at 11:22 EST: Potential PRZ here - 1.27 is 1293.75, .382 is 1293.75, 1.414 is 1294.25. good area to "take some off the table", as I think we will chop for a bit now. 1294.00 is also a visual off the daily chart.

Update at 12:17 EST: Old support becomes new resistance at that 1297.75 to 1297.25 PRZ. 5 waves up into that small PRZ, so we pullback. Let's see if we get to the small .618 fib level. Yep, .618 now hit, and possibly lower, as I have no buy pattern yet. IF the low at 1294.00 hold, THEN I will be looking for a buy pattern. Otherwise I will be looking for a sell against the 1297.50 high must made. Keep in mind that the higher timeframe charts remain bearish.

Update at 13:09 EST: 60min chart still bearish. abc now into test of 1294.00 low. Can we lift from here, or do we go lower? Watching lower timeframe charts carefully for market to tip its hand as to which way is more likely. Currently we have abc 3 wave pattern into small .707 fib level at 1295.00. 8min and 6000V chart are in buy position. This pattern makes for a small bullish gartley butterfly pattern. Just need price action to confirm that it wants to go up, otherwise down.

Update at 13:29 EST: 8min chart shows 3 bars with a low of 1295.00. Let's see if it will hold or not. 3 bar 3 tick rule here for a long off the 1295.00 low as a scalp only. This makes for a good entry with limited risk. Let's see if it will work or not. Volume has just about died, and higher timeframe charts are still bearish for now. Price action is bearish also. Expecting it to be stopped out since price action is bearish.

Update at 13:37 EST: Stopped on long scalp. IF 1294.00 is broken, THEN look for today's downside targets: 1290.50 to 1287.75. And down we go. Next major LIS is 1290.00.

Update at 14:14 EST: Interesting note -- 1292.00 is a 1.414 fib level and a 1.618 fib level for a small PRZ. Still bearish, and looking for lower lows .... eventually.

Update at 15:38 EST: So we make it to 1291.50 before retracing higher. There was a buy pattern on both 15min and 30min charts; as well as a potential one off the 60min chart. Also, towards the end of the day, and would expect some short covering to occur. The daily chart however, remains bearish for now.

Tuesday, August 22, 2006

ES #F 082206 Consolidation Day

The current high is 1307.75 and low is 1298.50. The move down from the high is in a 3 wave pattern. We have made a retracement of the move down from 13074.75 to 1298.50 that stopped at a 1.414 fib level. Currently we just tested the 1298.50 low, with the market waiting for an 08:30 EST report. The daily chart shows that we are in a consolidation/congestion range. The important LIS is 1297.75 -- old resistance becoming new support. IF it fails, THEN I will be looking for evidence that it has become resistance, and will be waiting for a JOT (jump on trend) opportunity to go short. Technically right now, we have a double bottom and a long entry for a scalp off the 1298.50 test. We have a possible 5 waves down from globex high to globex low, so expect some retracement now.

Update at 09:00 EST: Upside targets for this long off 1298.50 double bottom - 1302.25 gap fill, 1303, 1304..00, test of 1307.75 and possibly higher. So long as the 1298.50 low holds, we have a chance of going higher and making higher highs. While we had an inside day yesterday, the daily chart has no confirmed sell signal as of yet.

Update at 09:11 EST: IF the 1297.75 LIS does not hold, THEN expect lower targets: 1293.75, 1292.25, 1290.50, to 1283.50ish.

Update at 09:20 EST: We had a sell pattern on the 8min chart; a JOT 5034 pattern sell short. Target is the .618 at 1300.00 and then test of 1298.75 low.

09:22 EST: This abc move into 1300.00 makes for a small bullish gartley butterfly pattern long entry. However, the indicator is in the wrong position, so no long yet.

Update at 09:30 EST: IF we break through the 1298.75 low and the 1297.75 low, THEN the 120min and 60min charts will be more bearish with more downside to follow. Small gartley butterfly off the .786 retrace at 1299.25.

Update at 09:40 EST: gap filled and also the .618 at 1303.00. More upside to come, based on 60min chart. Looking for 1307.25 gap to be filled.

Update at 09:50 EST: Short term resistance at the .786 fib level of 1303.75. That makes for a bearish gartley butterfly pattern. However, longer term charts remain bullish, so scalp opportunity initially.

Update at 10:20 EST: 1304.00 target hit; looking for higher still.

Update at 10:55 EST: 120min and 60min charts both say up. No sell signal as of yet. Looking for 1304.75 short term resistance to break and for test of 1307.75 high and possibly new highs for today. Note: 1307.75 is prior LIS and also .886 fib of move down; also we have possible 5 waves up as well. Good scalp opportunity to the downside, with limited risk. IF 5 waves, THEN look for abc into .618 (which in this case, is at 1301.00)

Update at 11:21 EST: Scratch that short; price action positive; and higher timeframe charts bullish. Note: 1305.00 is a .707 fib off the day session only chart.

Update at 11:31 EST: 1305.75 is a .786 fib level and possible 5 wave completion for another sell. It is also a perfect 1:1 price projection. The .786 makes for a bearish gartley butterfly. The last move up, (either wave 3 or 5) had wave extension.

Update at 11:58 EST: Price fallen back down through the 1304.75 LIS and currently sitting on small UTL. Right below is another small LIS and potential support at 1303.75. Butterfly targets: 1303, 1301.50, 1301.00, 1300.25, 1298.75 test, 1297.00, test of 1297.75 low, and then possibly lower.

Update at 12:13 EST: Short term support at the 1303.00 which is .382 fib level and 34ema off 8min chart. Possible wave 4 for higher? Watching lower timeframes carefully. Price action is positive.

Update at 12:28 EST: Price went back to test the UTL, and now needs to stay above 1303.75 for more upside. Now that we fallen through, it becomes a blue ice failure on the 6000V chart. if we cannot pop back up over the 34ema, it will create a JOT sell short against this blue ice failure pattern.

Update at 13:06 EST: 1301.50 target (the .618 fib level) hit. More downside is possible based on higher timeframe charts. 1301.00 target hit.

Update at 13:27 EST: 5 waves down into 1299.25. Retracement time. Then possibly lower. Most of butterfly targets hit. Trailing 1 car to see how far it goes.

Update at 13:47 EST: Market more bearish now. Re-testing the 1298.75 low. Expecting it to break, and going to re-test the 1297.75 level. IF that breaks, THEN we have further downside to come. 1298.00 is a .886 fib level (range 1296.75 low to1307.75 high).

Update at 14:12 EST: 1297.75 LIS broken - let's see if it will become resistance for more downside.

Update at 15:25 EST: 1297.75 LIS held as support. Upside momentum now. We also had a 3 wave down structure into the 1297.75 LIS. Looking for more upside now.

Update at 16:00 EST: Resistance is currently at the .618 here or 1303.00. Possible bull flag for higher. Otherwise this is a good sell short entry with little risk.

Monday, August 21, 2006

ES #F 082106 The Day after Options Expiration

The ES #F is looking weak. Short from Globex high. We have a large gap down this morning. Higher timeframe charts say down for now. Both the 8min and 6000V are currently below the 34ema and the 89sma. We tested the globex low, for a good buy entry scalp. Market found s/t support at prior visual of 1301.25. IF we have 5 waves down, THEN look for abc back up into .618 to .786 fib levels. However, the gap is at 1307.25, which is closer to Friday's high of 1307.75. 60min and 120min remain bearish though with no buy signals, so any longs will have be scalps initially.

OP is now resistance with bearish price action. Downside targets for today: 1299.00, 1298, test of 1296.75 low, test of 1295.50, 1294.75, 1293.75ish, 1292.251and 1290.50ish. We also have a gap below at 1287.75 that remains to be filled. Today could be a trending day down.

Update at 09:44 EST: we have a small double bottom long signal for entry into the long retracement move -- however, 60min chart still bearish. The Day session chart only created a kicker signal patternupon the open. According to Stephen W. Bigalow, this candlestick pattern is one of the major ones, and is a very strong indicator. Let's see how this will play out for the day.

Update at 10:15 EST: We have tried to move up, but the market remains stuck in range and below OP. However, there is a buy signal now off the 8min chart, for the retracement move up. First target is the test of the current high at 1303.50 for possible wave c. Remember, the Day session only chart and 120min chart both have no buy signals yet.

Update at 10:51 EST: Possible 5 wave triangle here. OP is resistance. IF we have 5 wave triangle, THEN look for more down.

Update at 11:14 EST: Market funds s/t support at 1300.00, which is a .707 fib level. 120min chart still bearish with no buy signal yet.

Update at 11:31 EST: Globex low of 1300.50 is now backend support. Can we go up from here? Signals remain mixed, and higher timeframe charts say still bearish somewhat ( no buy signal).

Update at 11:51 EST: Market bearish; Looking for momentum to pick up to the downside.

Update at 11:57 EST: First downside target at 1299.00 hit; looking for lower still.

Sunday, August 20, 2006

Qualcomm (QCOM) Chart Analysis 082006


Upside targets: $40.58, $42.96, $45.35ish and possibly higher.

Stock has found short term support here at the $32.00 level. Bulls came out to take this stock higher this past week.

Home Depot (HD) Chart Analysis 082006


Monthly chart shows no buy pattern as of yet; however, we do have support at the LBB and the stock has found support at this level before. Will it hold this time or not? Watching lower timeframe charts closely for clues.

This chart shows that last week, bulls have come out of the woodwork to buy this. We have closed above prior LIS at $34.50ish. We have spent 5 weeks now at this support level. Upside targets for this possible move up: $37.00, $38.43, $39.75ish.

The first wave up off the $32.85 low is a 3 wave pattern, so this is corrective. Stock has found support here, so let's see how far the bulls want to take this -- We do have a small PRZ at the $37.00 level.

Amgen (AMGN) Chart Update 082006


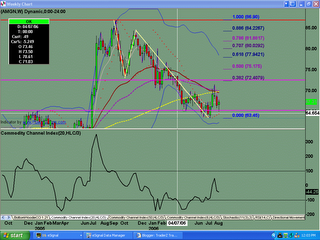
Daily chart shows the low to be holding; bought on test of low. However, need to go through current resistance of $70.20 (small LIS) before it can go higher.

Upside targets: $72.40, $75.00, $77.94 and possibly $80.00 to $81.88

$NDX WeeklyChart Analysis 082006


Monthly chart is looking to go through the resistance of LIS at 1559.47. The key for up is for this LIS to become support.

Weekly chart currently shows upside strength. Initial upside target is PRZ (potential reversal zone) at the LIS and .618 fib level of 1635 to 1642ish.

We have had 5 straight days of higher highs, right into 89sma as resistance. Will it hold the market back, at least in the short term? Only time will tell.

$SPX Weekly Analysis 082006


Monthly chart still shows strength to the upside. No sell pattern as of yet.

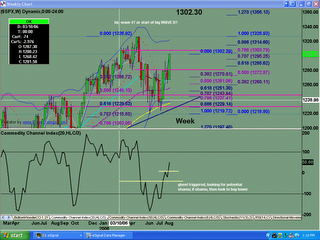
Weekly chart has a buy pattern in place. Looking for test of top and possibly higher.

We had 5 days of upside strength, with no signs of weakness.

$INDU Weekly Chart Analysis for 082006


We had 5 days of straight up last week. Friday ended at the .707 fib retracement level.

Weekly chart clearly shows market is in buy mode, with no sell signal in sight. Looking for the .786 fib, then test of high and possibly higher as possible.

Monthly chart shows strength to the upside, with no sell pattern in sight.

Zeus (ZEUS) Chart Analysis 082006


The monthly chart shows topping action and a sell pattern forming (not complete and confirmed until end of August). We are currently trading below prior resistance and LIS. Old resistance becomes new support -- support appears to be broken here.

Weekly chart confirms the monthly short bias. We have just broken an uptrend line, fallen through important LIS, and trading below 34ema.

Daily chart shows that there might be s/t support forming, and a retracement from current lows is possible. We are trading around the 200sma currently, but have fallen through the daily 34ema as well as the 89sma. I will be looking for a sell trigger at a higher price. A short here will be higher risk and lower reward.

This is Dr. Pasternak's Short Trade Call for this week:

Dr. Pasternak's Best Short Trade for the Week of August 21, 2006...
STOCK: Olympic Steel (ZEUS, $28.66)
QUANTITY: 50 shares
SELL ON STOP AT: $27.89 (Good until cancelled)
LIMIT: $27.69TARGET: $20.05
STOP LOSS: $34.55

CURRENT MOON
lunar phase