Nutrisystem (NTRI) Chart Analysis

Monthly chart still bullish with no sell pattern in sight. We are however, in a retracement/corrective wave. Interesting that Cramer reports that there are lots of short sellers on this stock.

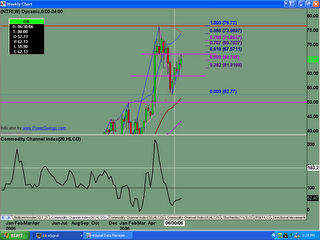
Weekly chart shows current resistance at $67ish. IF stock sells off against this resistance level, THEN I will target the low and look to see if buyers come into the market at that level.

Daily chart says to be prepared for a pullback to test the current lows at the $63.00 level


0 Comments:
Post a Comment
<< Home