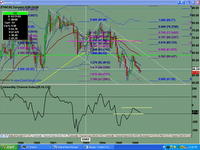
Fannie Mae (FNM) Chart Analysis

Monthly chart in a clear downtrend from the high in 2001. Curently trading below all moving averages. LIS at $58.50 level holding market down for now.

Weekly chart showed small sign of possible reversal with a bullish engulfing pattern, but the past week's price action indicates that the bears are still in force for now. LIS at the $50 range currently holding price down. Looking for test of $46 level low then test of $41.30 level low.

Need to clear $50 range before more upside is possible. Charts showing weakness, and more downside action is more likely.


0 Comments:
Post a Comment
<< Home