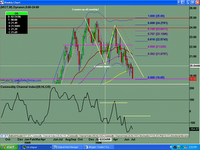
Motorola (MOT) Chart Analysis
I started following MOT when I heard an ex-hedge fund manager turned newsletter promoter, talking up his expertise on how to find investment opportunities to take advantage of the China play. One of the picks in his report was Motorola. Based on my analysis at that time, I didn't really see a good buy opportunity. Rather, I had the perfect setup for a sell opportunity.

Looks like 3 waves up into .382 fib level. I can count 5 waves in the third wave up. The market turned downwards from this .382 fib level, which is also prior resistance and now forms a LIS and change of polarity. I have a clear sell signal off this chart.

We are right at a LIS at the $18.70 level. Should this break, there will be more downside to come.

Since the monthly chart is in sell mode, I would be looking at the daily chart for JOT (jump on trend) entries to go SS (sell short).


0 Comments:
Post a Comment
<< Home