Vulcan Materials (VMC) Chart Analysis

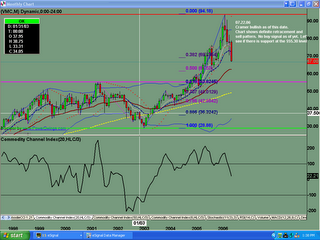
Cramer is bullish on rock companies saying there is a boom in road building and highway construction. My trading system shows a clear sell pattern in place on the VMC monthly chart.

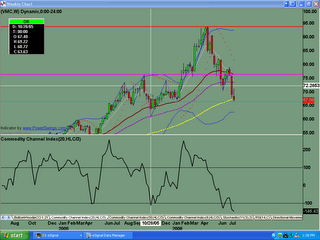
Weekly chart shows that prior resistance level of $76.31 failed as support, and now we have LIS, with a blue ice failure for lower.

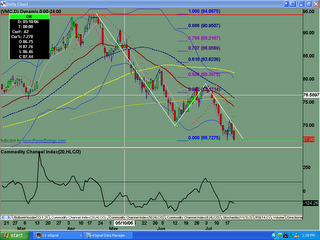
The daily chart shows possible support for a bounce, but we have fallen through the 200sma and now we do have strong resistance above. Can we clear that resistance to go higher, or will we fail yet again, and the bears take this stock lower, as indicated by the monthly chart?

0 Comments:
Post a Comment
<< Home